
Chapter 17 · 17.24
Share prices and other time series in a chart
Watch it in a short video
Share prices, your savings account balance, daily visitors to your website or your energy meter readings: they are all time series, one number per date. In Euro-Office you can turn them into a clear chart, but there are a few pitfalls. The dates become a line of their own, the axis starts at 0 so everything looks flat, and the stock chart needs the columns in a fixed order. In this article we solve them one by one.
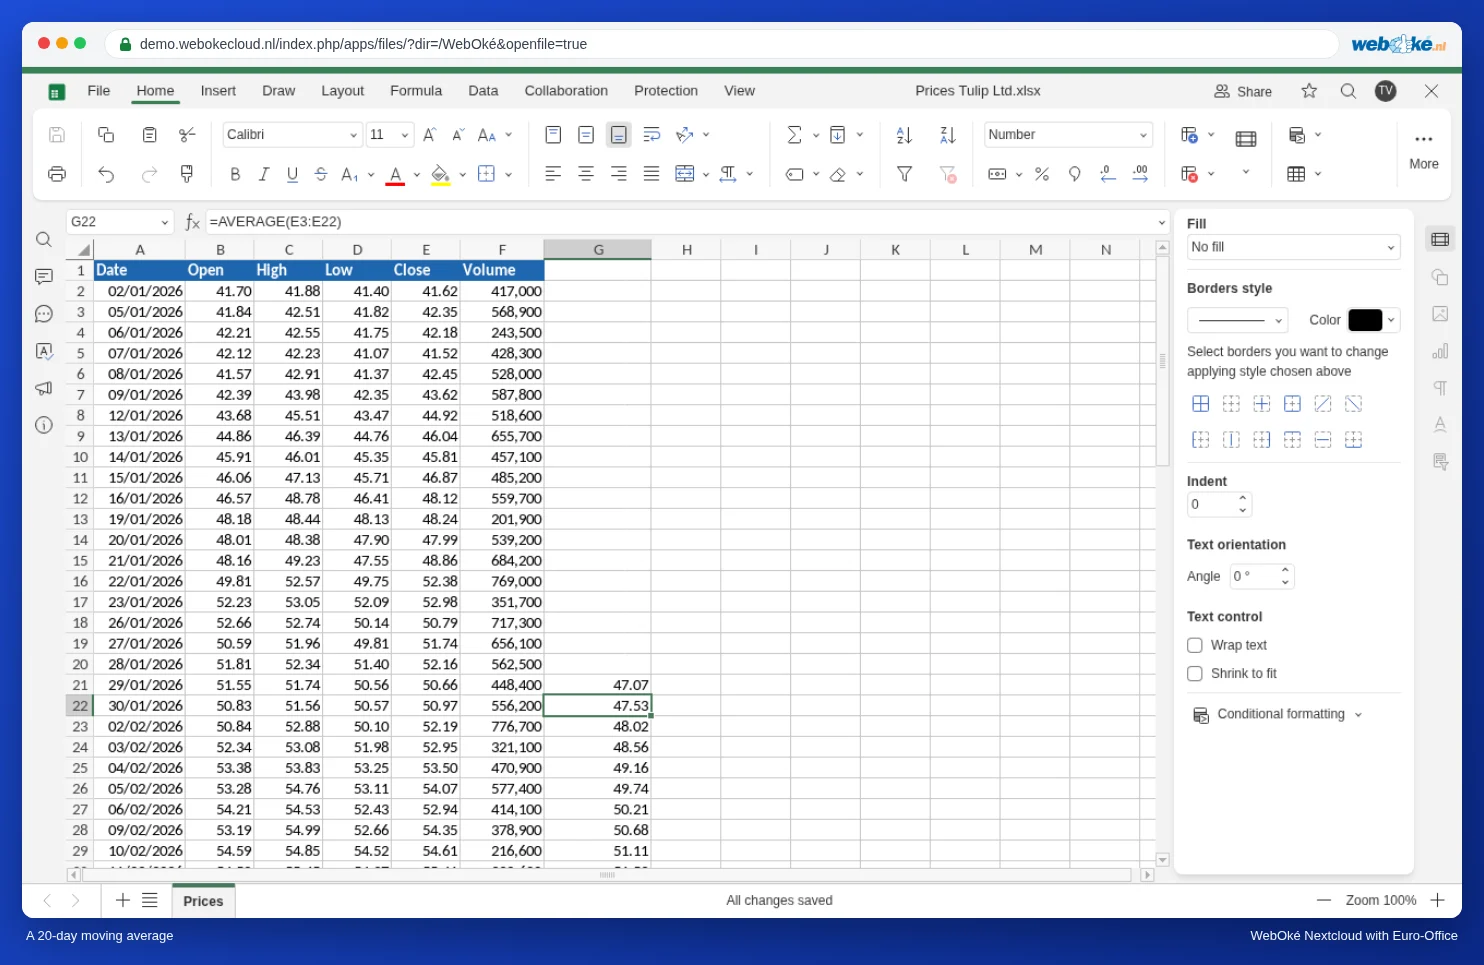
As an example we use six months of daily prices for the fictitious share Tulp NV, on the worksheet Koersen: column A holds the date, B the opening price, C the highest price, D the lowest price, E the closing price and F the volume. The header row is row 1, and the 128 trading days are in rows 2 to 129.
Step 1: a moving average
A share price fluctuates every day. The average of the last 20 trading days shows the trend. Because the range moves one day further on each row, this is called a moving (or rolling) average.
- In G1, type the heading 20-day avg.
- In G21, the row of the twentieth trading day, type:
=AVERAGE(E2:E21) - Click G21 and double-click the small square at the bottom right of the cell, the fill handle. Euro-Office fills the formula down to the last row of the list.
G22 now contains =AVERAGE(E3:E22), G23 =AVERAGE(E4:E23), and so on. Rows 2 to 20 stay empty: there aren't 20 days to average yet. Want a shorter or longer period, for example 50 days? Then start in G51 with =AVERAGE(E2:E51).
Step 2: a line chart over whole columns
You want the date, the closing price and the average in one chart. These columns aren't next to each other. So click the column header A, hold down Ctrl and click the column headers E and G. Whole columns have an advantage: if you add more days later, the chart grows along automatically.
- On the Insert tab, click Chart and under Line choose the first image.
- Make the chart bigger: on the right under Size, set for example a width of 20 cm and a height of 11 cm. With hundreds of dates you need that space.
Now you see the first pitfall. To Euro-Office a date is a number (2 January 2026 is 46024), so it draws a separate line for it, high above the prices. The prices themselves lie as a flat line at the bottom, and below the chart you see the numbers 1, 2, 3 instead of dates.
Step 3: move the dates to the axis with Select data
- Click the chart and on the right choose Select data.
- Under Legend entries (series), choose the series Date and click Delete.
- Under Horizontal (category) axis labels, click Edit.
- Enter the range with the dates, without the header:
=Koersen!$A$2:$A$129and click OK. - In the Chart data window, click OK once more.
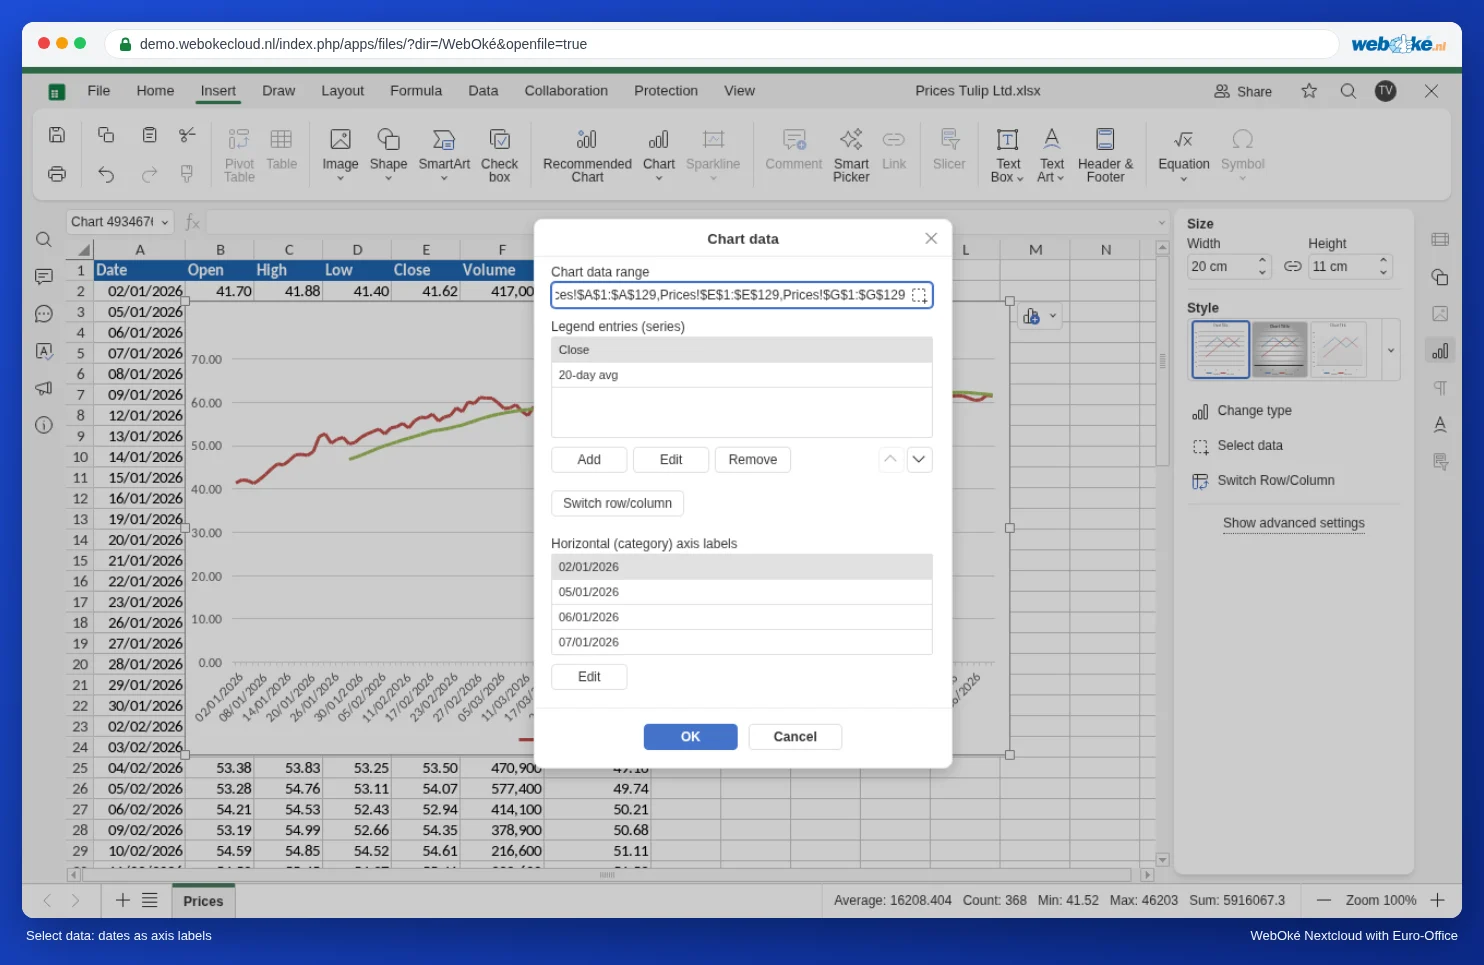
The dates now appear below the chart and you see two lines: the closing price and the 20-day average.
Step 4: don't start the axis at 0
The vertical axis still starts at 0, while the price moves between 40 and 65 euros. This makes the fluctuations look smaller than they are.
- Click the chart and at the bottom right choose Show advanced settings.
- On the Layout tab, set the Legend to Top.
- On the Vertical axis tab, set the Minimum value to Fixed and enter 35. Click OK.
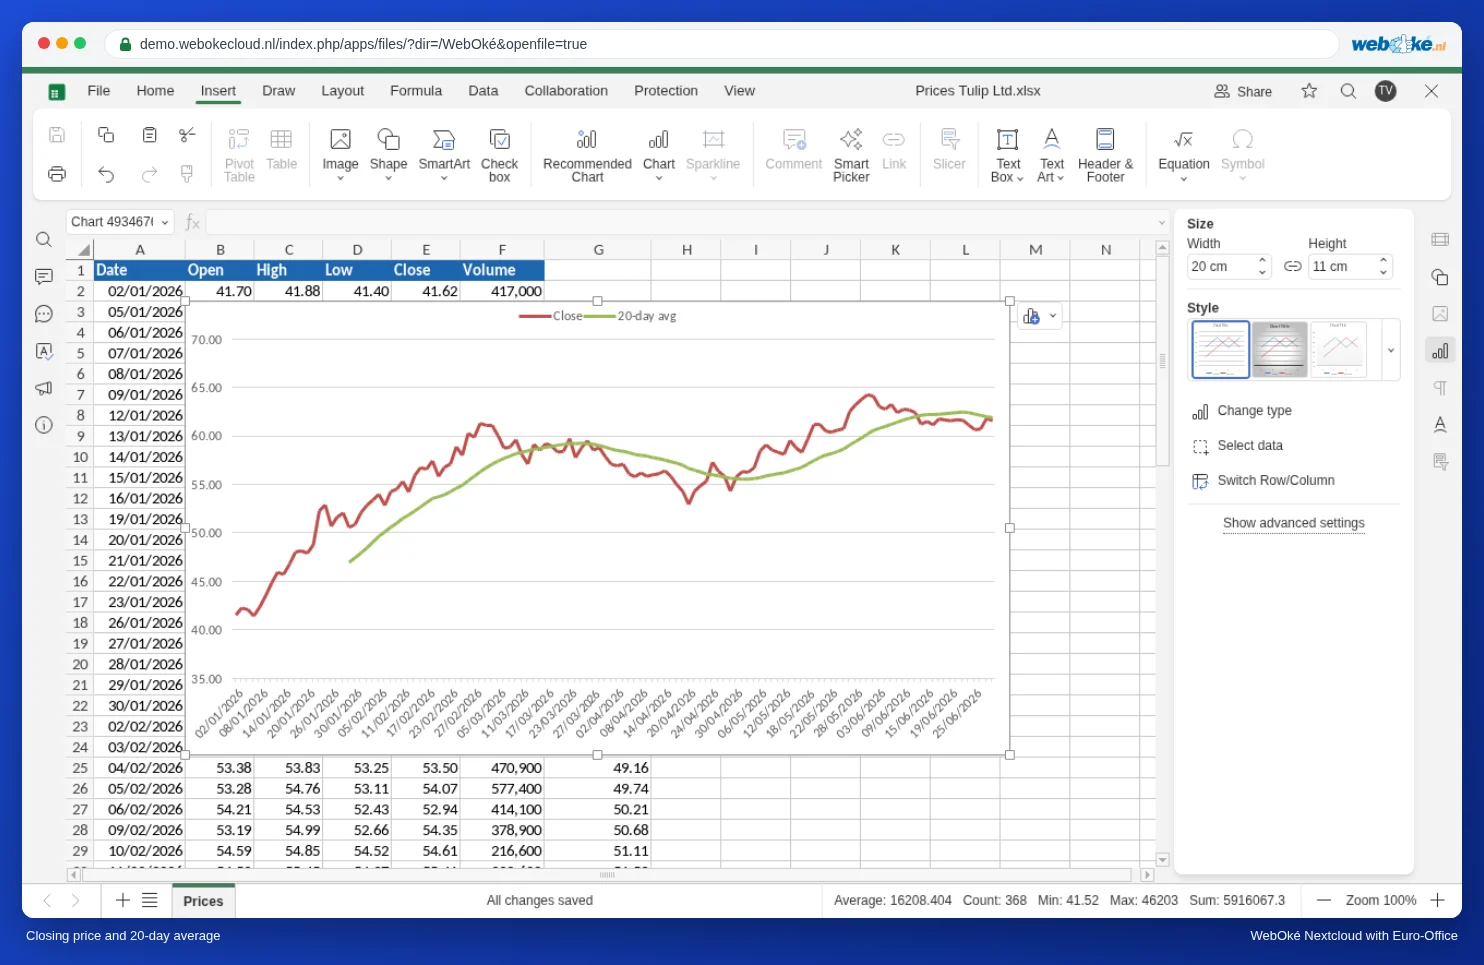
For share prices, an axis that doesn't start at 0 is common: it's about the movement, not the level. For revenue or quantities it's misleading; there you let the axis start at 0 (see A chart with columns and a line on a second axis).
When the closing price crosses the average from below or from above, the trend often reverses. Many investors also add a 50-day or 200-day average in a separate column.
Step 5: a stock chart with open, high, low and close
A stock chart (also called a candlestick chart) shows four prices per day at once. For this, Euro-Office needs the columns in exactly this order: date, open, high, low, close. If they're in a different order, you get the message Incorrect row order.
- In the Name Box at the top left above column A (where the cell name normally appears), type A1:E129 and press Enter. This is a quick way to select a large range without dragging.
- Click Insert, Chart. The stock chart is in the Stock group, to the right of Area.
- Make the chart bigger and, via Show advanced settings, set the Legend to None and the Minimum value of the vertical axis to Fixed, 35.
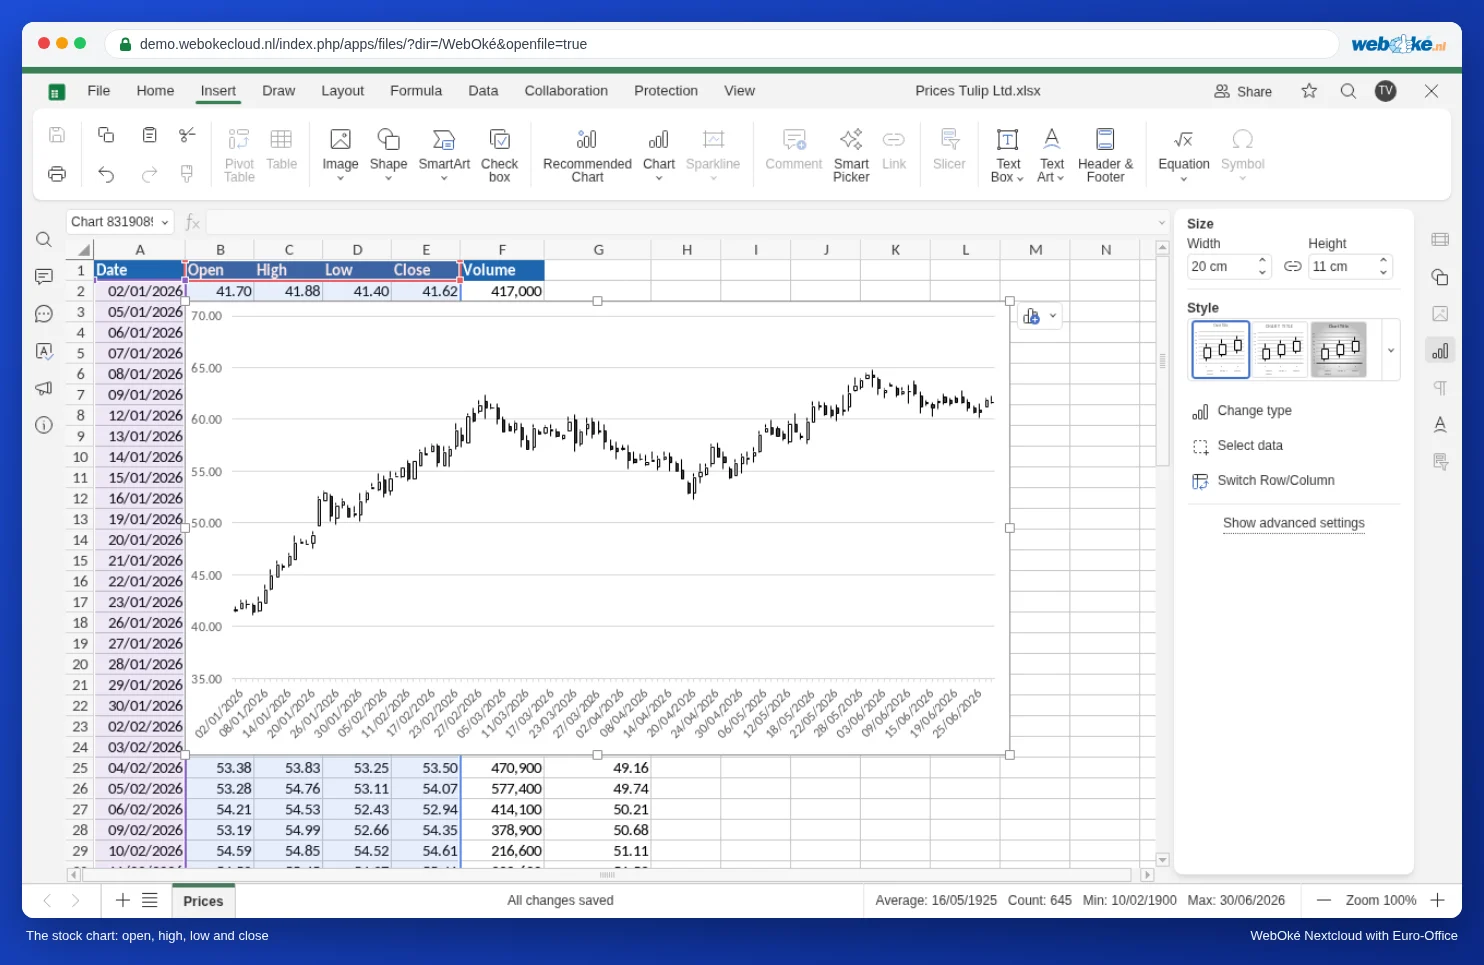
Each candlestick is one day. The box runs from the opening price to the closing price: white if the price rose that day, black if it fell. The line above it reaches up to the highest price, the line below it down to the lowest.
Tips for advanced users
- Long periods: under Vertical axis, turn on the Logarithmic scale. A 10 percent rise then has the same height everywhere, whether the price is 5 or 500 euros.
- Fewer dates below the axis: on the Horizontal axis tab, set the Interval between labels to 20, for example, so you see about one date per month. With Label format you choose a short format, such as just the month.
- Weekends: Euro-Office places the dates side by side as categories. Days without trading (weekends, public holidays) therefore leave no gap. For share prices that's exactly what you want.
- Adding volume: want the price as a line and the volume as columns, each with its own scale? Then use a combination chart with a secondary axis, as in A chart with columns and a line on a second axis.
Pitfalls
- The dates are aligned to the left of the cell: then they are text, not dates, for example after pasting from a website or a CSV file with a different date format. Convert them to real dates first, otherwise Euro-Office won't sort or calculate with them correctly.
- Newest date at the top: many banks and stock exchange websites put the most recent day at the top. Sort the list in ascending order by date first, otherwise the chart runs from right to left and the average shifts in the wrong direction.
- Message Incorrect row order with the stock chart: put the columns in the order date, open, high, low, close. The volume doesn't belong in it.
- The average runs ahead: if you put the first formula
=AVERAGE(E2:E21)in G2 instead of G21, each row averages the 20 days after that date. Your average then responds to prices that weren't known yet on that day. Put the formula on the last day of the range.
The video accompanying this article shows all the steps. Creating a regular chart is explained in Creating charts.