
DirectAdmin Resource Usage and slow websites (Resource Limit Is Reached)
Every hosting package gets its own share of the server: an amount of processing power (CPU), memory, disk speed (I/O) and simultaneous processes. If your website uses more, it gets slowed down or visitors get an error message. Other websites on the server aren't affected, but your own site is.
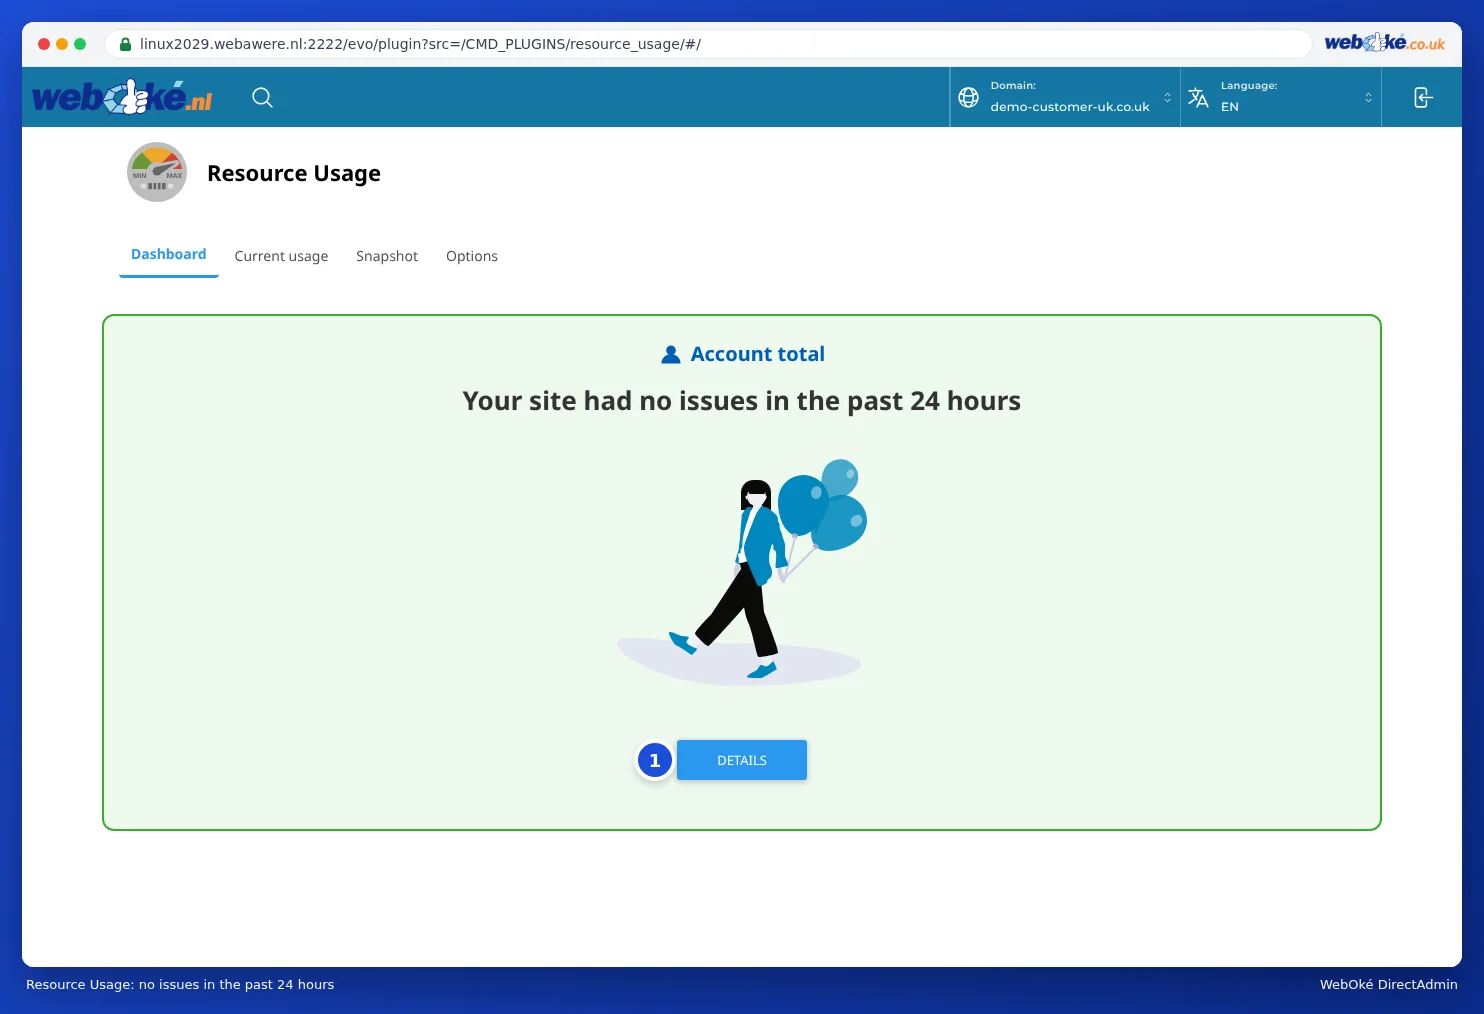
You can see how much your package uses in DirectAdmin under Extra Features, Resource Usage. The Dashboard tab shows you right away whether your package has hit a limit in the past 24 hours. If so, click Details for the graphs. Under Timeframe you can look back up to 30 days. Pay particular attention to the Faults: this is how often your package ran into a limit. 0 is good.
The components
- CPU: the processing power. If your graph is already high while there are few visitors, you'll definitely run into problems when you get more visitors. This is often caused by a heavy plugin or a script that uses the database inefficiently.
- Memory: rarely a problem. If things go wrong here, a script is using far too much memory.
- Entry Processes: the number of simultaneous processes (not the number of visitors). Once the limit is reached, visitors get the error message 503 Service Unavailable or Resource Limit Is Reached.
- I/O: how much is read from and written to the disk. If you hit this limit, your website becomes slower.
What can you do?
- Find out which pages or plugins are slow with X-Ray, see below.
- Use as few plugins as possible and a cache plugin, such as LiteSpeed Cache for WordPress.
- Do you have multiple domains in one package? They share the same limits. Give a busy website its own package.
- Does your website simply need more, for example a busy webshop? Then choose a larger package in My WebOké: open your package under My Products and use the Change hosting package card. Your website, mail and domains stay right where they are.
Read more tips to make your site faster in My website is slow or uses too much CPU: here's how to make it faster.
Using X-Ray to see what takes time
- In DirectAdmin, under Extra Features, click X-Ray and then Start tracing.
- Select your domain under URL and enter
/*under Specify mask to measure the entire site. Click Run. - Open your website in a private window and click around, especially on the slow pages.
- In X-Ray, click the eye icon next to your measurement. Open the request that took the longest.
Does one plugin stand out with a much longer time than the rest? Then that's probably the culprit. Update it, look for a lighter alternative or disable it. Do you instead see lots of plugins that each take a little time? Then you simply have too many. More information can be found in X-Ray: tracking down slow pages.
See also in the DirectAdmin manual: 503 or 'Resource Limit Is Reached': what now? and My website is slow.
Detailed explanation with screenshots: Resource Usage: CPU, memory and processes in the DirectAdmin manual.